In May 2020, Google announced that they were introducing a set of new metrics that were designed to quantify user’s experiences on websites. The idea was to give developers and webmasters insight into how their website’s experience impacted their users and create a benchmark that could be used to optimise website performance. These new metrics, called Core Web Vitals, would also be folded into Google’s algorithm as a ranking factor.
Core Web Vitals in essence breaks down your website’s experience for the user. The concept is that a great user experience means that a visitor is able to navigate around the page and site, achieve their desired actions or goal and do it in a simple and smooth manner. Thus you have a better-converting website. A bad experience means that users are annoyed or frustrated by their experience and ultimately don’t achieve what they were looking to do. Making your website conversion rate is low.
What metrics does Core Web Vitals measure?
There are three main elements that are measured are Page Load Performance, Ease of Interaction and Visual Stability of Page. Each of these metrics is meant to help you as webmasters and developers understand the direction needed to improve user experience (UX) on your website.
Core Web Vitals metrics are designed to act as a standard for developers and webmasters to understand how users interact with their websites. These metrics give insight into how a user perceives their experience with a given webpage or website. By giving website owners an understanding of how each user navigates, interacts and how easy they achieve their desired goal when accessing the webpage.
So what exactly are they:
Page Load Performance (KPI – Largest Contentful Paint)
The largest contentful paint metric is a mouthful to say, but essentially it is how quickly your website or page loads. Generally, users now want to have instant access to their desired websites or at least quick access to the sites that are presented to them from search engines. This means that the quicker a page loads the better the experience and the more likely a user will stay and the better the conversion rate based on the intent of the page.
It breaks down the page into sections and measures how long it takes for a web page’s largest piece of content to completely load in each section. So even if you have a mostly simple copy on a page but have a large image gallery further down the page, that will be the point that is measured. By measuring the largest content areas individually means that you need to optimise the page as a whole not just target specific areas to improve.
Ease of Interaction (KPI – First Input Delay)
One of the biggest issues for your users is not actually being able to do anything when they arrive at your website. It’s a sure thing that you have experienced it yourself at some point, the page you clicked on loads and you click on a button or a link and nothing happens. You have to wait, continuously clicking for it to finally work what feels like minutes later (it’s probably only 30 or 40 seconds but…). As mentioned above, users are looking to access content and achieve their goals quickly… they want instant gratification from every website they enter.
This is where First Input Delay comes in, this metric measures how quickly and easily it is to interact with your web page. Google takes a percentage overview of your usership and uses that data to benchmark your website’s performance. The plus side for this metric is that Google has provided a clear indication as to what is good and what is bad. 100ms is good and over 300ms is very bad.
Visual Stability of Page (KPI – Cumulative Layout Shift)
The stability of a page as it loads can be extremely important to lowing your user’s frustration as even if your page takes a little longer to load then the user can still progress. That is unless the button suddenly shifts as they try to click it. This kind of event is what Cumulative Layout Shift measures, it tracks the percentage of the page that suffers from movement due to any other element on your page or because of DOM elements.
As with First Input Delay, Google has given a formula for you to work out the impact of this metric: Impact X Distance = Cumulative Layout Shift.
How do they impact my website?
Core Web Vitals technically don’t technically have a direct impact on your site, like most of Google’s changes they are more related to search ranking than how your website works. However, needless to say, lower search rankings have an impact on your site directly with less traffic being driven through.
However, unlike many of the other updates that Google has introduced the Core Web Vitals update directly relates to how a user interacts with your site. This insight can and will allow you to improve the way in which your website performs and the kind of experience that users get from it.
How to optimise for core web vitals?
So you have seen what Core Web Vitals is and what it means for your website, but how do you make improvements to ensure that your site is ready for it? Unfortunately, there is no simple ‘one size fits all’ solution. What needs to be done will depend on what your website is about, what kind of intent you have on individual pages, and what your business needs are.
Your first step in understanding what you need to do to improve your vital statistics is to identify the problems. Do you this there is a range of free tools for you to assess what the issues are and provide insight into how to fix them. The tools are:
Google Search Console – Core Web Vitals Report
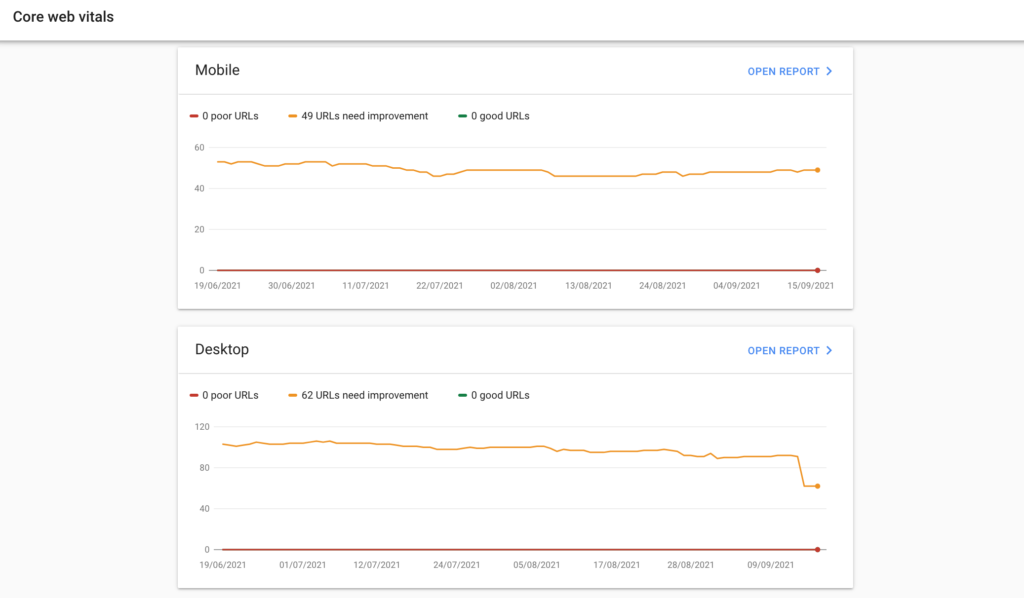
This tool is built within Google Search Console and should be your first stop in reviewing your Vitals KPIs. To access it you will need to have your website verified within Search Console and your site needs to have about 90 days worth of data to work from. But this report will give you insight into how your site is performing on both desktop and mobile breaking it down across the three main metrics; making it easy to see where there are specific issues.
If you are looking to assess a single URL or have a new page that you want to check data on then PageSpeed Insights will give you a direct and easy way to see the Core Web Vitals that are causing you issues and basic guidance on how to improve them.
Chrome Lighthouse Report
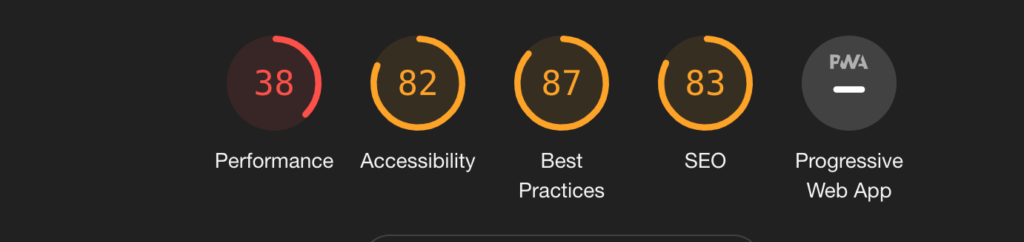
This report can be run from within your Chrome browser and provides an assessment of your website’s performance across the board. It breaks down the fundamentals of your website into specific sections based on performance, Best Practices, Accessibility, and SEO.
- To run the report simply click anywhere on the page of the site you want to review and select ‘Inspect’ from the drop down menu.
- A new window will open up and on the top navigation select Lighthouse.
- Click on the blue button to generate the report.
- You will be given a score for each section so you can instantly see what is causing you problems but it won’t give you instructions on how to fix them.
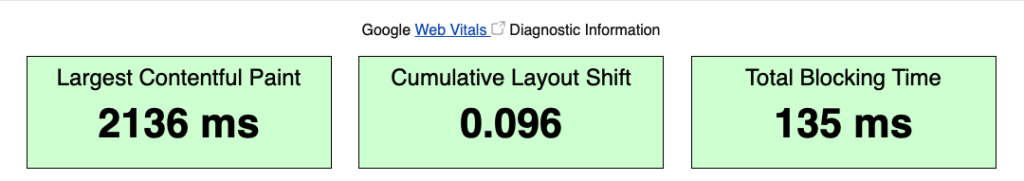
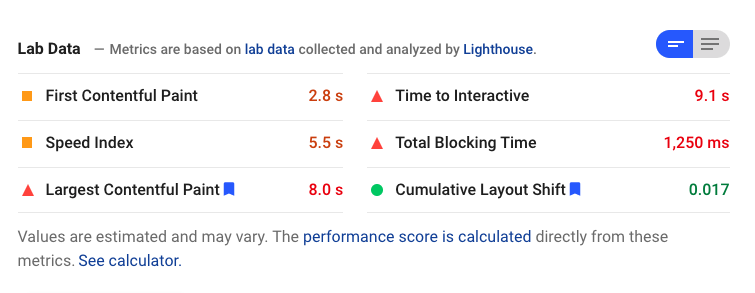
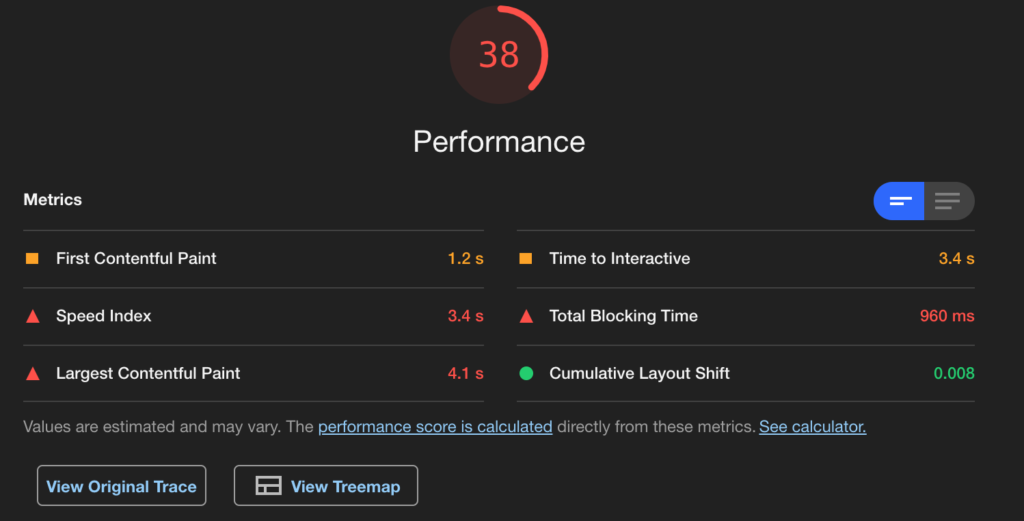
This isn’t a Google tool however, it gives you a clean and quick way of reviewing the three main metrics. The report does go into more detail as your scroll down, but at the top, there is colour coding to show how good or bad your site is based on the metrics.
And finally…
There is another alternative to doing it yourself. You can speak with us. Our digital marketing and development teams are fully versed in the needs and requirements to get your website in line with Core Web Vitals. Why not drop us a line and see how we can help you optimise your website across all your SEO needs.

What are Core Web Vitals?
In May 2020, Google announced that they were introducing a set of new metrics that were designed to quantify user’s experiences on websites. The idea was to give developers and webmasters insight into how their website’s experience impacted their users and create a benchmark that could be used to optimise website performance. These new metrics,…

How to write an agency brief
We’ve had many clients come to us with their projects but have not been able to articulate them or structure them into a cohesive project. This isn’t their fault, being able to shrink down the whole scope of a project into a succinct document isn’t easy and can feel like climbing a mountain. Building a…